
Original address:
https://www.thethingsnetwork.org/labs/story/store-and-visualize-data-using-influxdb-and-grafana/
The installation configuration of influxdb and grafana is not mentioned here.
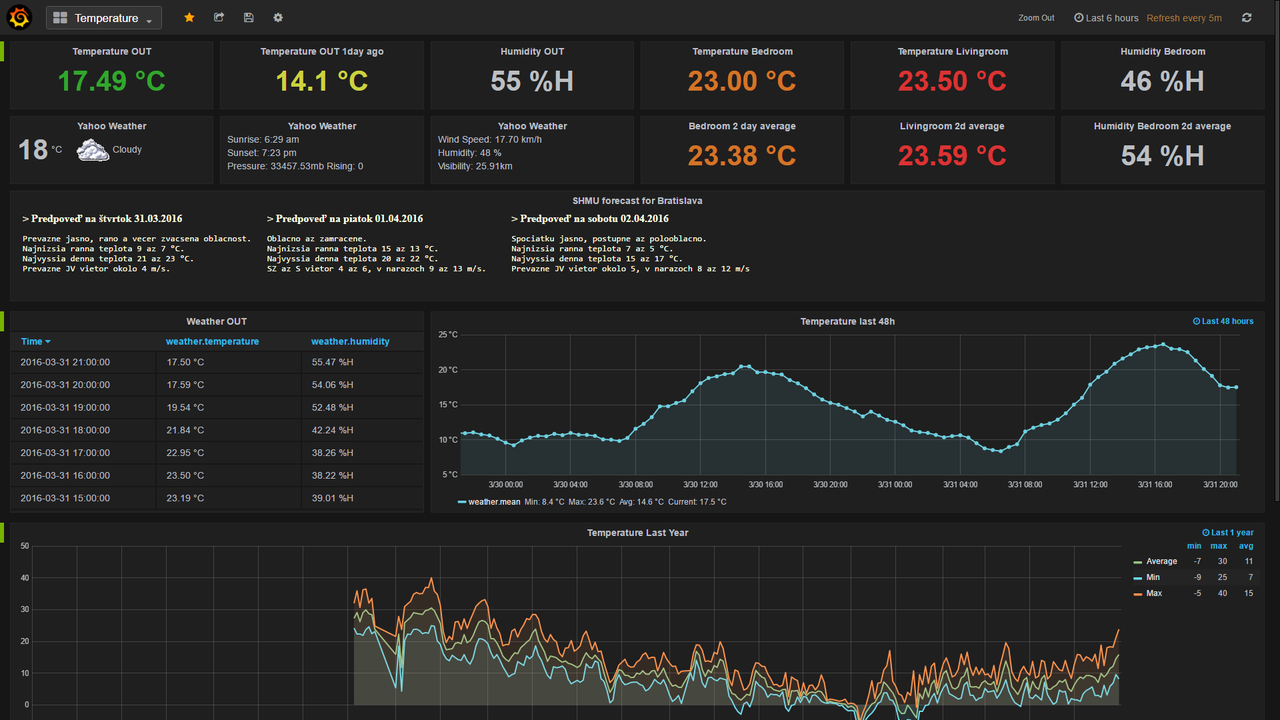
The use of grafana and influxdb effectively helps us visualize real-time data and dynamic changes from Heltec nodes.
Use TTN to influxdb:
1. Download and install Node-red (takes a long wait)
If you are on a Raspberry Pi or any Debian-based operating system, including Ubuntu and Diet-Pi, you can use the Pi install script available here.
bash <(curl -sL https://raw.githubusercontent.com/node-red/raspbian-deb-package/master/resources/update-nodejs-and-nodered)
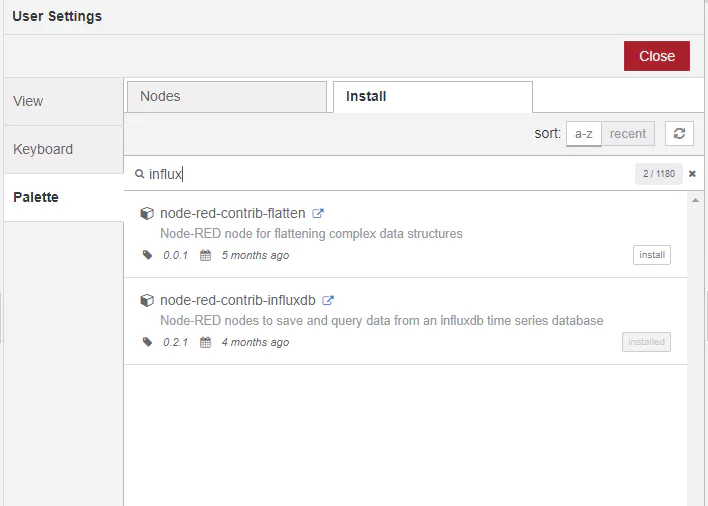
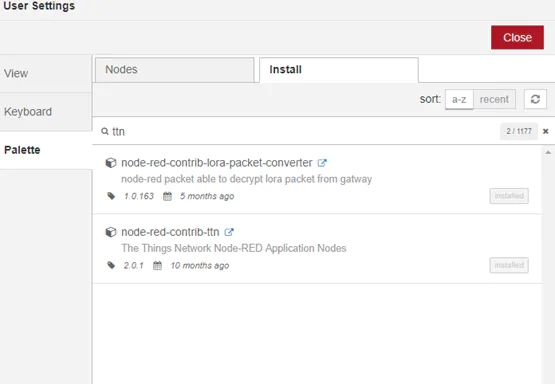
2. Add influx and ttn palettes to Node-red
Setting up Node-Red with InfluxDB and ttn
via commandline:
cd ~/.node-red npm install node-red-contrib-influxdb
npm install node-red-contrib-ttn@2.0.1
We should now restart Node-red to assume/detect the new nodes.
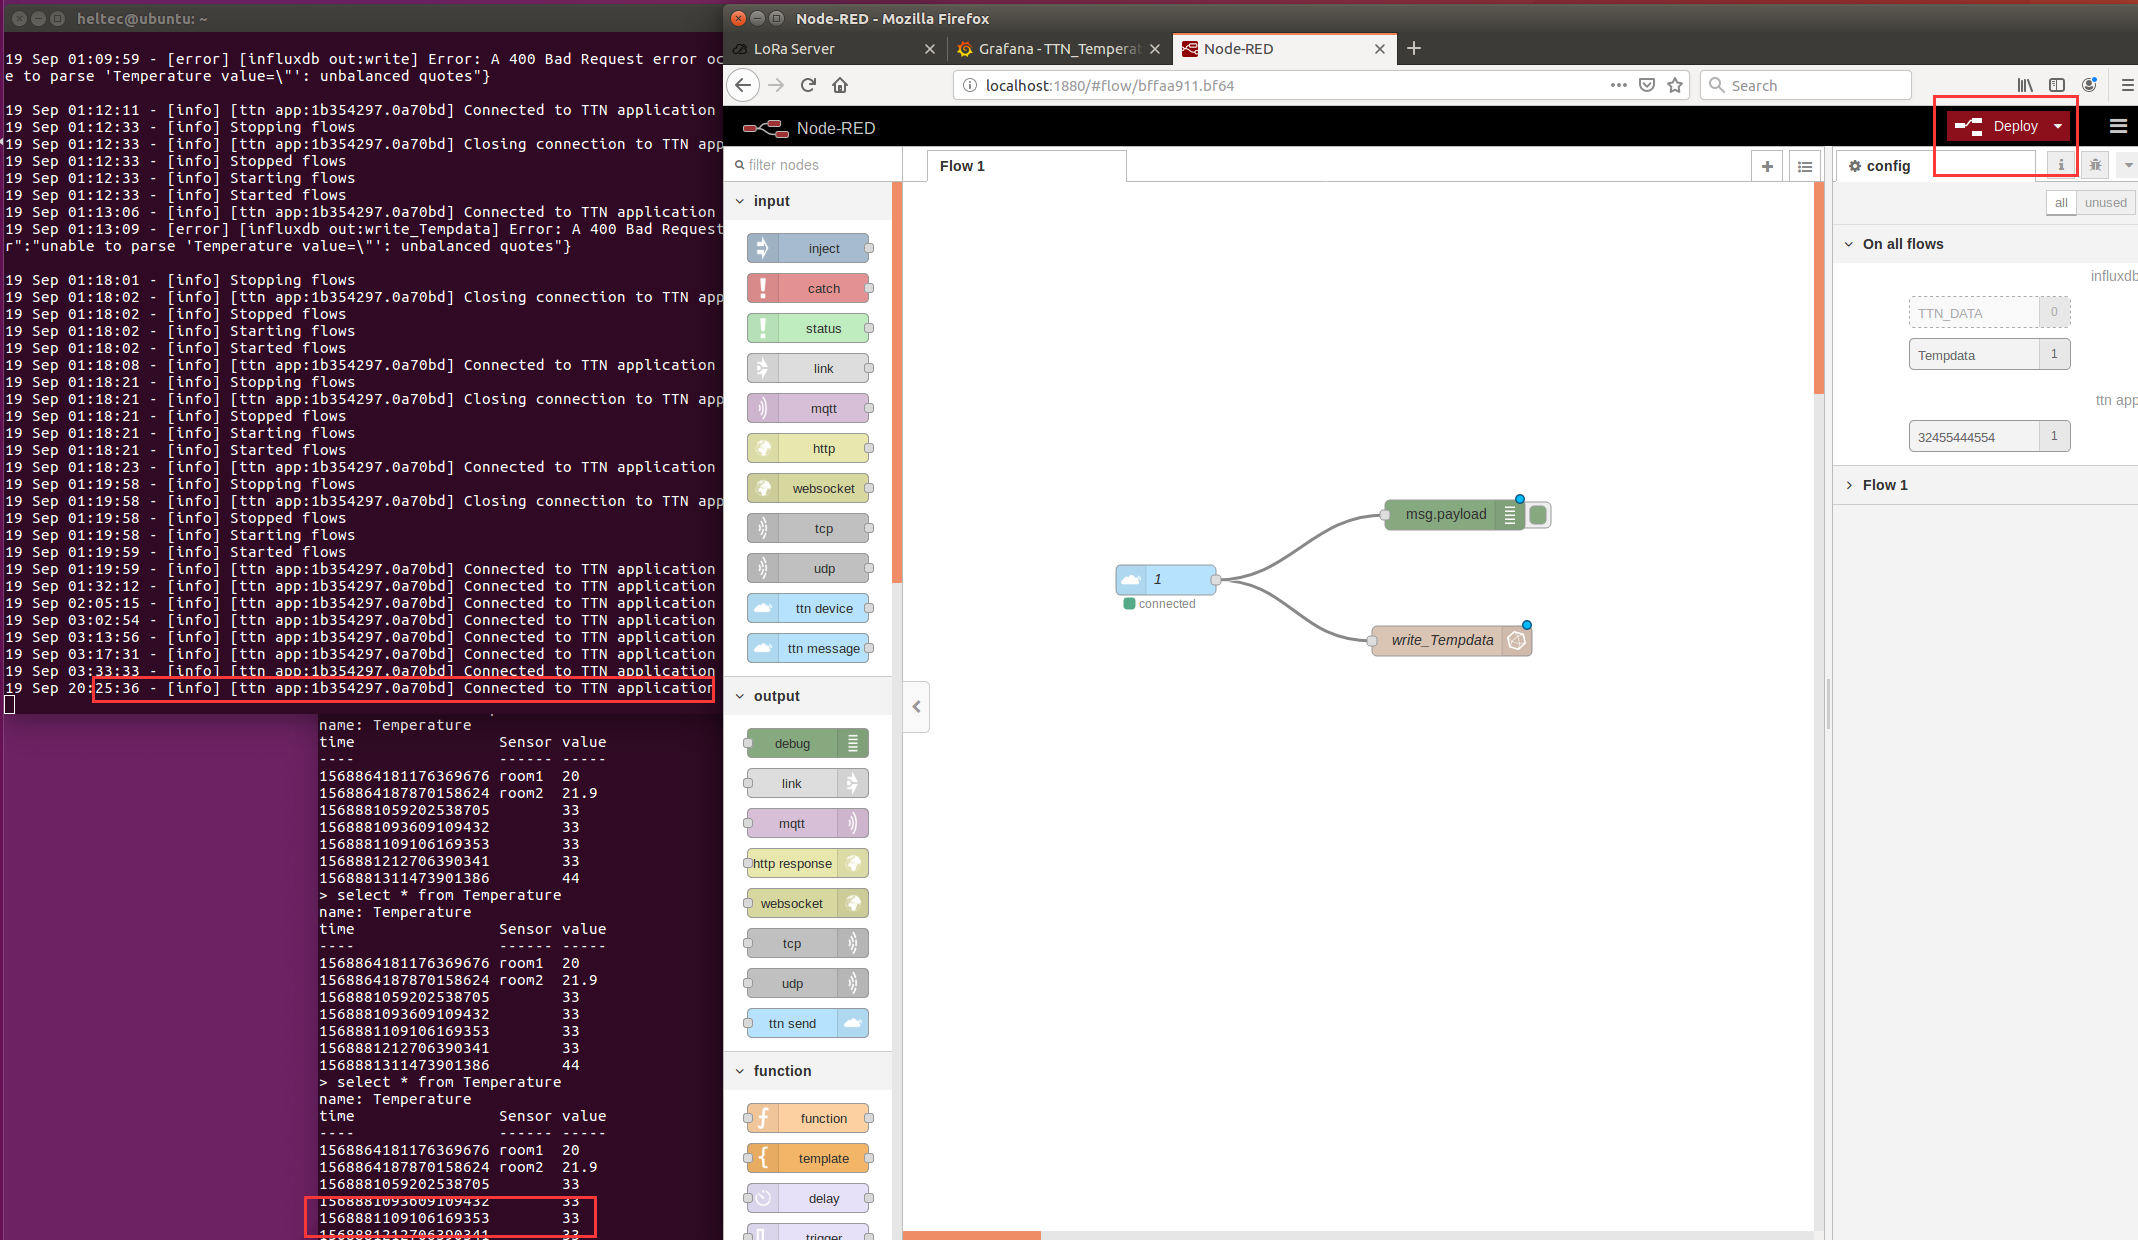
3. Configure Application EUI and ACCESS KEYS corresponding to ttn in flow
There is no difficulty here, just fill in the corresponding application in TTN.
Remember to click Deploy when you are done filling out.
We can observe in the node-red log on the left that it is connected to applicaotion at this time.
Make sure the data flow of TTN->influxdb is correct, we can use the TTN Device SIMULATE UPLINK.
Like this:
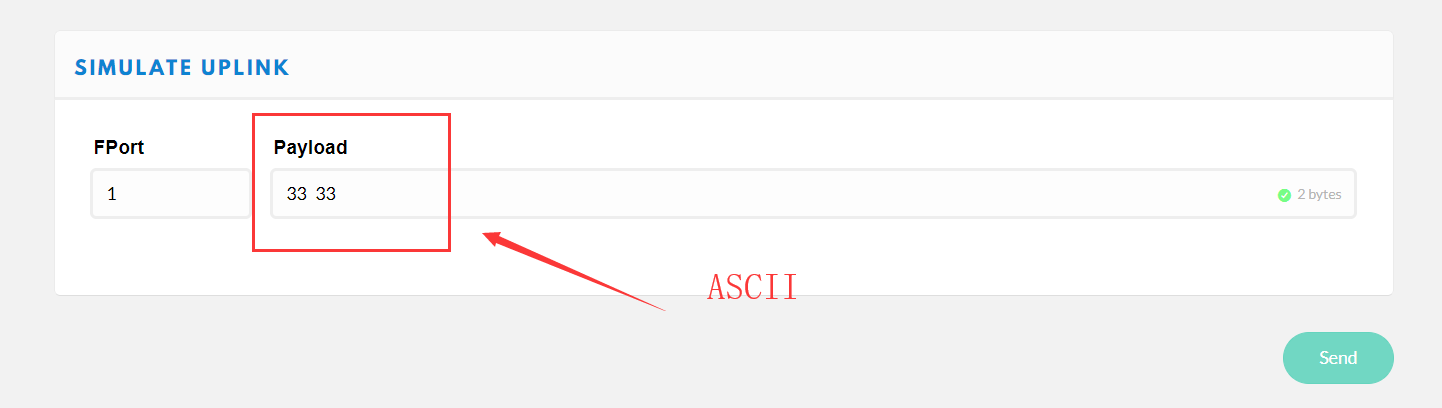
Click Send, go back to the influxdb and see if the measurement inserts a new row.
Back to grafana:
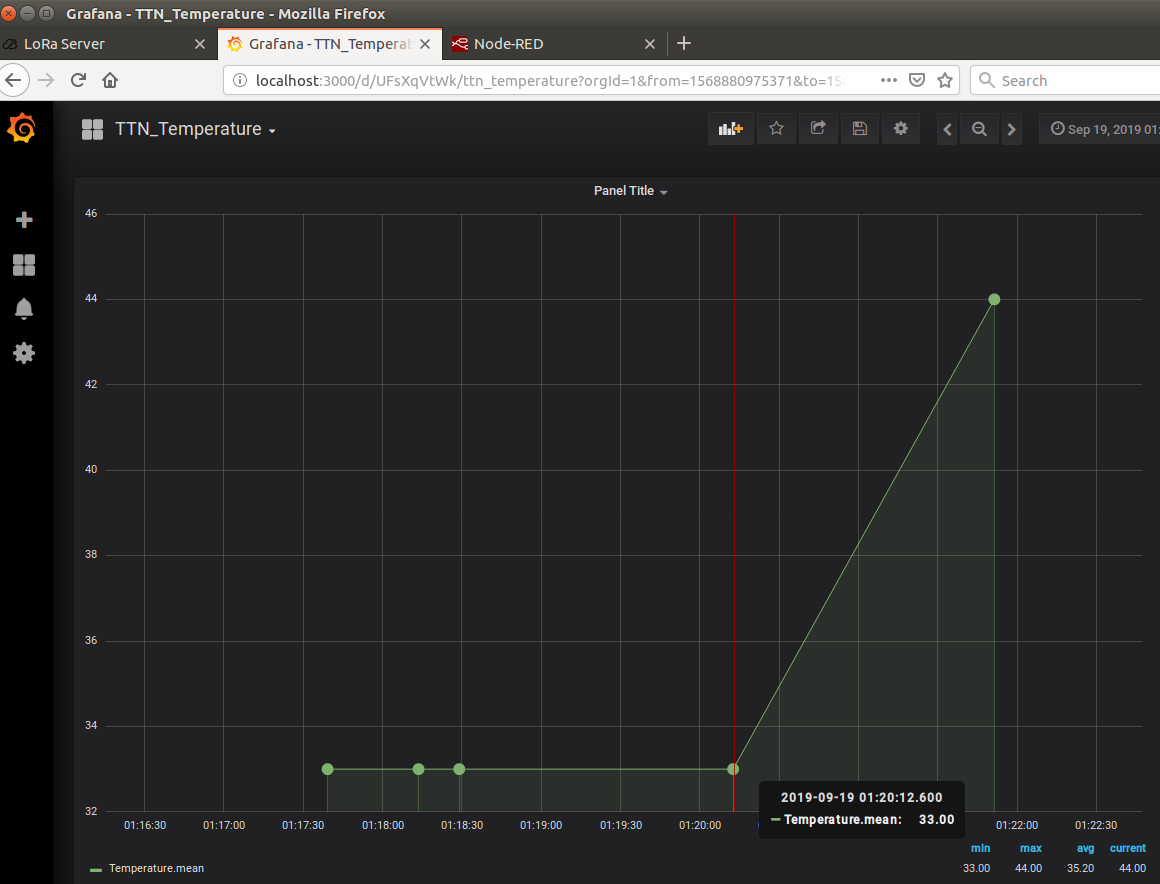
Establish the correct flow of data flow, replace the device with a real device.