Config of packet forwarder in RAK gateway
   "radio_0": {
        "enable": true,
        "type": "SX1250",
        "freq": 867500000,
        "rssi_offset": -215.4,
        "rssi_tcomp": {"coeff_a": 0, "coeff_b": 0, "coeff_c": 20.41, "coeff_d": 2162.56, "coeff_e": 0},
        "tx_enable": true,
        "tx_freq_min": 863000000,
        "tx_freq_max": 870000000,
        "tx_gain_lut":[
            {"rf_power": 12, "pa_gain": 1, "pwr_idx": 4},
            {"rf_power": 13, "pa_gain": 1, "pwr_idx": 5},
            {"rf_power": 14, "pa_gain": 1, "pwr_idx": 6},
            {"rf_power": 15, "pa_gain": 1, "pwr_idx": 7},
            {"rf_power": 16, "pa_gain": 1, "pwr_idx": 8},
            {"rf_power": 17, "pa_gain": 1, "pwr_idx": 9},
            {"rf_power": 18, "pa_gain": 1, "pwr_idx": 10},
            {"rf_power": 19, "pa_gain": 1, "pwr_idx": 11},
            {"rf_power": 20, "pa_gain": 1, "pwr_idx": 12},
            {"rf_power": 21, "pa_gain": 1, "pwr_idx": 13},
            {"rf_power": 22, "pa_gain": 1, "pwr_idx": 14},
            {"rf_power": 23, "pa_gain": 1, "pwr_idx": 16},
            {"rf_power": 24, "pa_gain": 1, "pwr_idx": 17},
            {"rf_power": 25, "pa_gain": 1, "pwr_idx": 18},
            {"rf_power": 26, "pa_gain": 1, "pwr_idx": 19},
            {"rf_power": 27, "pa_gain": 1, "pwr_idx": 22}
        ]
    },
    "radio_1": {
        "enable": true,
        "type": "SX1250",
        "freq": 868500000,
        "rssi_offset": -215.4,
        "rssi_tcomp": {"coeff_a": 0, "coeff_b": 0, "coeff_c": 20.41, "coeff_d": 2162.56, "coeff_e": 0},
        "tx_enable": false
    },
which corresponds to global_conf.eu_863_870.json, i.e. Europe 868 MHz. The AT session looks like
+OK
+LORAWAN=1
+OK
+ChMask=0000000000000000000000FF
+OK
+AppPort=2
+ConfirmedNbTrials=4
+OK
+DutyCycle=15000
+OK
+ADR=1
+OK
+OTAA=1
LoRaWAN EU868 Class A start!
joining...TX on freq 868300000 Hz at DR 5
TX on freq 868300000 Hz at DR 5
Event : Tx Done
RX on freq 868300000 Hz at DR 5
Event : Rx Timeout
RX on freq 869525000 Hz at DR 0
Event : Rx Timeout
TX on freq 868300000 Hz at DR 5
TX on freq 868300000 Hz at DR 5
Event : Tx Done
RX on freq 868300000 Hz at DR 5
Event : Rx Timeout
RX on freq 869525000 Hz at DR 0
Event : Rx Timeout
TX on freq 868500000 Hz at DR 5
TX on freq 868500000 Hz at DR 5
Event : Tx Done
RX on freq 868500000 Hz at DR 5
Event : Rx Timeout
RX on freq 869525000 Hz at DR 0
Event : Rx Timeout
TX on freq 868100000 Hz at DR 5
TX on freq 868100000 Hz at DR 5
Event : Tx Done
RX on freq 868100000 Hz at DR 5
Event : Rx Timeout
RX on freq 869525000 Hz at DR 0
Event : Rx Timeout
TX on freq 868100000 Hz at DR 5
TX on freq 868100000 Hz at DR 5
Event : Tx Done
RX on freq 868100000 Hz at DR 5
Event : Rx Timeout
RX on freq 869525000 Hz at DR 0
Event : Rx Timeout
TX on freq 868500000 Hz at DR 5
TX on freq 868500000 Hz at DR 5
Event : Tx Done
RX on freq 868500000 Hz at DR 5
Event : Rx Timeout
RX on freq 869525000 Hz at DR 0
Event : Rx Timeout
TX on freq 868300000 Hz at DR 5
TX on freq 868300000 Hz at DR 5
Event : Tx Done
RX on freq 868300000 Hz at DR 5
Event : Rx Timeout
RX on freq 869525000 Hz at DR 0
Event : Rx Timeout
TX on freq 868100000 Hz at DR 4
TX on freq 868100000 Hz at DR 4
Event : Tx Done
RX on freq 868100000 Hz at DR 4
Event : Rx Timeout
RX on freq 869525000 Hz at DR 0
Event : Rx Timeout
TX on freq 868500000 Hz at DR 5
TX on freq 868500000 Hz at DR 5
Event : Tx Done
RX on freq 868500000 Hz at DR 5
Event : Rx Timeout
RX on freq 869525000 Hz at DR 0
Event : Rx Timeout
TX on freq 868100000 Hz at DR 5
TX on freq 868100000 Hz at DR 5
Event : Tx Done
RX on freq 868100000 Hz at DR 5
Event : Rx Timeout
RX on freq 869525000 Hz at DR 0
Event : Rx Timeout
TX on freq 868100000 Hz at DR 5
TX on freq 868100000 Hz at DR 5
Event : Tx Done
RX on freq 868100000 Hz at DR 5
Event : Rx Timeout
RX on freq 869525000 Hz at DR 0
Event : Rx Timeout
TX on freq 868300000 Hz at DR 5
TX on freq 868300000 Hz at DR 5
Event : Tx Done
RX on freq 868300000 Hz at DR 5
Event : Rx Timeout
RX on freq 869525000 Hz at DR 0
Event : Rx Timeout
TX on freq 868500000 Hz at DR 5
TX on freq 868500000 Hz at DR 5
Event : Tx Done
RX on freq 868500000 Hz at DR 5
Event : Rx Timeout
RX on freq 869525000 Hz at DR 0
Event : Rx Timeout
TX on freq 868500000 Hz at DR 5
TX on freq 868500000 Hz at DR 5
Event : Tx Done
RX on freq 868500000 Hz at DR 5
Event : Rx Done
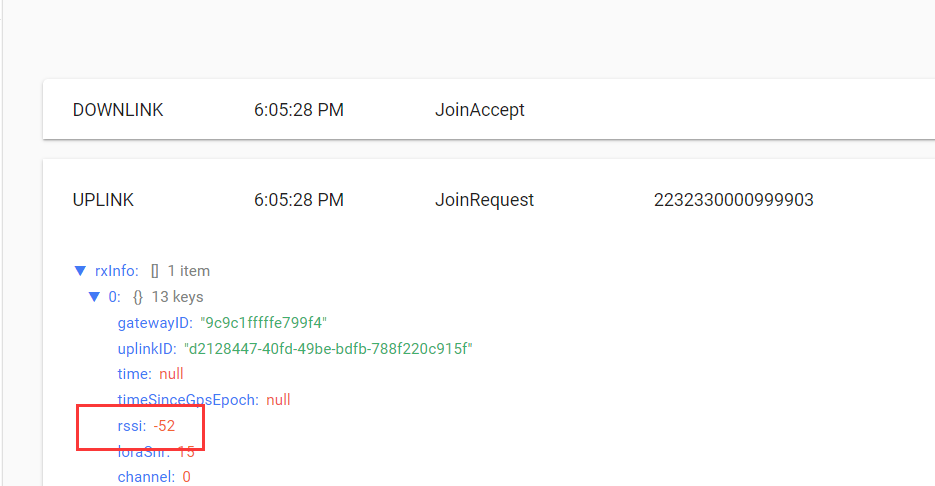
joined
Sending data (not received by gateway)
+Send Hex Data:AA
unconfirmed uplink sending ...
TX on freq 868300000 Hz at DR 5
TX on freq 868300000 Hz at DR 5
Event : Tx Done
RX on freq 868300000 Hz at DR 5
Event : Rx Timeout
RX on freq 869525000 Hz at DR 0
Event : Rx Timeout
And, as I already said, other devices configured for 868 MHz work fine with the gateway.
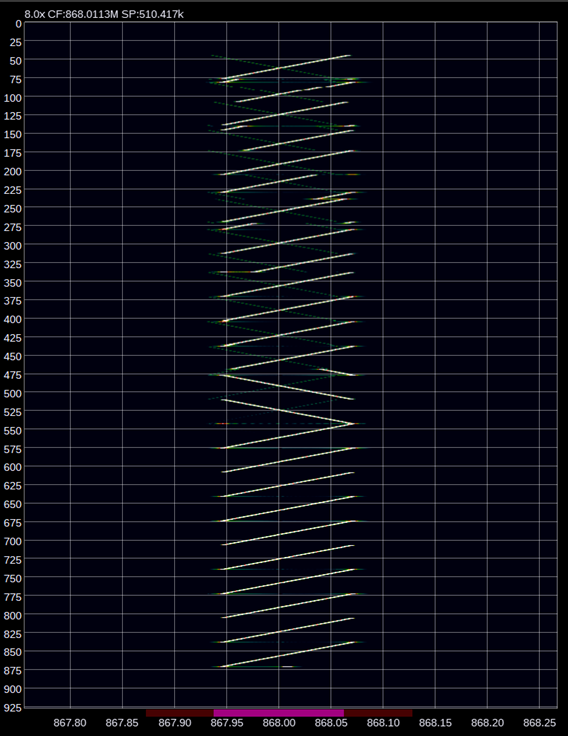
I have checked the radio signal emitted from the CubeCell with a SDR (LoRa 868 MHz SF12 “00” data), looks ok to me: